


Abdulrahman K Al Asmari1*, Zabih Ullah1, Ahmed Al Eid2, Saeed Al Kadasah3, Fahad Al Sabaan4, Hamoud Al Shahrani5
1Research Center, Prince Sultan Military Medical City, Riyadh 11159, Saudi Arabia
2Department of Pharmacy, Prince Sultan Military Medical City, Riyadh 11159, Saudi Arabia
3Department of Psychiatry, Prince Sultan Military Medical City, Riyadh 11159, Saudi Arabia
4Department of Endocrinology, Prince Sultan Military Medical City, Riyadh 11159, Saudi Arabia
5Department of Ophthalmology, Prince Sultan Military Medical City, Riyadh 11159, Saudi Arabia.
ORIGINAL RESEARCH ARTICLE
Volume 2, Issue 3, Page 124-130, September-December 2014.
Article history
Received: 5 December 2014
Revised: 20 December 2014
Accepted: 27 December 2014
Early view: 30 December 2014
*Author for correspondence
E-mail: [email protected]
Objective: For the extraction and quantitation of plasma fluoxetin (FLX), simvastatin (ST) and simvastatin acid (STA), a rapid, robust and sensitive method using solid-phase extraction (SPE) cartridges and high pressure liquid chromatography (HPLC) with ultraviolet (UV) detection was developed.
Material and methods: Waters HLB cartridges were used for the sample clean-up and purification. Separation of analytes and internal standard (IS) mewastatin was achieved using Phenomenex C18 column (150 x 2 mm, 3 μm). Mobile phase consisted acetonitrile and phosphate buffer (65:35, v/v) in isocratic mode with a flow rate of 0.3 ml/min.
Results: The relative retention times for FLX, ST, STA and IS were 1.5, 8.5, 3.7 and 5.0 min respectively. The calibration curves were plotted by using peak area ratios of analytes to IS. The plots were linear from 10-1500 ng/ml for FLX and 10-1000 ng/ml for ST and STA. Intra and inter precision values for FLX ranged from 4.69 to 12.61, for ST 3.36-13.38 and for STA it ranged from 3.73 to 12.93% respectively. The 10 ng/ml was the lowest limit of quantitation (LLOQ) for FLX, ST, and STA.
Conclusion: The specificity and sensitivity of this method make it appropriate to estimate plasma level of FLX, ST, and STA in preclinical studies in a single run.
Keywords: RP-LC, Solid phase extraction, simvastatin, fluoxetin, simvastatin acid..
INTRODUCTION
Simvastatin, 2,2-dimethylbutanoic acid (1S,3R,7S,8S,8aR)-1,2,3,7,8,8a-hexahydro-3,7-dimethyl-8-[2-[(2R,4R)-tetrahydro-4-hydroxy-6-oxo-2H-pyran-2-yl]ethyl]-1-naphthalenyl ester, is antihyperlipidemic drug. It acts through competitive inhibition of 3-hydroxy-3-methylglutaryl coenzyme A reductase (HMG-CoA reductase), the rate limiting enzyme for cholesterol synthesis in the liver (Kuzaj et al., 2014). ST is effective and well tolerated for the treatment of increased cholesterol level (Rosolova et al., 2014). It is also effective in reducing mortality and morbidity in coronary heart diseases. Bioavailability of ST after oral administration is low, because only 5% of the orally administered ST reaches the systemic circulation (Patel and Sutariya, 2014). Whereas FLX, N-methyl-3-phenyl-3-(2,2,2-trifluoro-p-tolyloxy) propylamine hydrochloride, is an antidepressant and differs structure wise and pharmacologically from the tricyclic antidepressant. FLX selectively inhibit the reuptake of serotonin in presynaptic neurons (Maya et al., 2000).
ST combined with FLX provides a potential mechanism for the anxiolytic and antidepressant properties of drugs in animal models (Santos et al., 2012). The monitoring of plasma levels of these drugs will be advantageous in the clinical or preclinical settings. Variation in pharmacodynamic responses may occur particularly at steady state, due to interaction, non-compliance, with concomitantly administered drugs or with other possible causes.
Several methods are available for the analysis of ST alone in plasma including liquid chromatographic (LC) coupled to ultra violet (UV) (Yang et al., 2003) detector gas chromatography mass spectrometric (GCMS) (Morris et al., 1993), micellar electrokinetic capillary chromatography (MEKC) (Srinivasu et al., 2002), voltammetry (Coruh and Özkan, 2006), spectrophotometry (Wang and Asgharnejad, 2000) and liquid chromatographic mass spectrometry (LCMS) (Barrett et al., 2006, Zhao et al., 2000, Jemal et al., 2000). Similarly, a few methods also have been reported for the analysis of FLX alone in plasma by gas chromatography (GC) with electron capture detection (ECD), (Dixit et al., 1991). HPLC with fluorescence detection (Kaddoumi et al., 2001, Guo et al., 2002, Gatti et al., 2003) and HPLC–UV detection (Maya et al., 2000, Thomare et al., 1992, Holladay et al., 1998, Tournel et al., 2001).
In this report, we describe the use of SPE cartridges for rapid sample extraction procedure for the determination of low level of ST, STA and FXL in rat plasma in a single run. The developed method offers a simple and fast sample preparation procedure for quantitation of ST, STA and FXL in plasma via RP-LC–UV detection.
MATERIALS AND METHODS
Reference standards ST, STA and IS (mewastatin) were obtained from Clearsynth Ltd. Mumbai India. FLX was obtained from Ranbaxy Research Laboratories, India. HPLC grade acetonitrile (purity 99.9%) was purchased from Sigma-Aldrich, Germany. Sodium dihydrogen phosphate was obtained from Fluka analytical, Sigma-Aldrich, Netherland. Methanol was obtained from Sigma-Aldrich, Germany. Water used in the entire analysis was prepared in-house with Milli-Q water purification system procured from Millipore (Millipore Corporation, USA). Other chemicals used were of analytical grade from commercial sources.
Liquid chromatography conditions
Chromatographic separation was achieved by using a Phenomenex C18 column (150 x 2 mm, 3 μm particle size), attached to UHPLC of Thermo Scientific-Dionex Ultimate 3000 (Serial # 7248679, Part # 5035.9200) equipped with a quaternary solvent system, an auto sampler, solvent manager and a PDA and visible detector ((Serial # 8074857, Part # 5082.0010). The mobile phase for the analysis consisted of phosphate buffer (25 mM, pH 4.5) and acetonitrile (35:65 v/v) in non-gradient elution mode, which was degassed. The flow rate of the mobile phase was at 0.3 ml/min. A fixed amount of 20 µL of sample solution was injected in each run. The total chromatographic run time was 10 min. The column was maintained at 30±5 0C, and the pressure of the system was 153 bar.
Sample extraction protocol
A solid phase extraction method was developed to isolate FX, ST and STA from plasma. The thawed samples were vortexed to ensure complete mixing of contents. 100 µL of mewastatin working solution was mixed with 500 µL aliquot of each plasma sample in polypropylene tubes. 100 µL of phosphate buffer was added into these polypropylene tubes and vortexed again for 30 seconds to ensure complete mixing. The pretreated samples were then transferred to SPE cartridges (Waters, HLB), which had been preconditioned using methanol and water (LC-grade). After centrifugation the analytes were eluted off the cartridges with 20% methanol in water. Eluents were evaporated to dryness at 25 psi and 40 oC under a stream of dry nitrogen. The residue was reconstituted with 300 µL of mobile phase, transferred into vials and 20 µL was injected into the UHPLC system for analysis.
Preparation of standard stocks and working solution
Primary stock solutions of FLX, SV, SVA and IS were prepared in mobile phase. Different stock solutions were used to prepare calibration standards (CS) and quality control samples (QC). A fresh common working solution of IS containing 300 ng/mL was prepared every day by appropriate dilution of the stock solution in mobile phase. Common aqueous CC and QC working solution for FLX, SV and SVA were prepared by serially diluting the stock solution with mobile phase and the final concentrations were corrected accounting for potency, molecular weight and the actual weight transferred. All the solutions were protected from light and stored below 5 oC.
Preparation of calibration curve samples (CC) and quality control samples (QC)
Common CC samples were prepared in blank rat plasma by spiking 2%, v/v of the aqueous working solutions for a concentration range of 10-1000 ng/mL for ST and STA and 10-1500 ng/mL for FLX respectively. Common QCs were prepared at lower limits of quantitation (LLOQC) 10 ng/mL, low level quality control (LQC) 250 ng/mL, medium level quality control (MQC) 500 ng/mL and at higher level of quantitation (HQC) 750 ng/mL, for ST and STA. Similarly QC samples were prepared for FLX, LLOQC as 10 ng/mL, LQC as 350 ng/mL, MQC as 750 ng/mL and HQC as 1150 ng/mL. All the spiked samples were stored below -80 oC.
Methodology for validation
Calibration curves were constructed from blank sample (plasma sample processed without IS), blank+IS samples and eight point calibration standards (lowest and highest standards were used in duplicates) for FLX, ST and STA in plasma. The acceptance criteria for these calibration curves was a correlation coefficient (r) of 0.9900 or better, and each back-calculated standard concentration must be within 15% deviation from nominal value except for the lower limit of quantitation (LLOQ), for which the maximum acceptable deviation was set at 20%. At least 67% of the non-zero standards were required to meet the acceptance criteria including acceptable lower (LLOQ) and upper limit of quantification (ULOQ). The following parameters were evaluated during validation of the method: linearity, precision, accuracy and recovery.
Linearity
The linearity was performed on three batches of spiked samples. Each batch of spiked plasma samples included one complete set of calibration curve standards and six replicates of quality control samples at LLOQC, LQC, MQC and HQC levels. Linearity of the method was determined by plotting the area ratio of analytes/IS against Known concentration of analytes. Calibration measurements were subjected to least squares regression analysis (1/x2) to provide information on the slope, y-intercept, correlation coefficient (r) and the back-calculated concentrations.
Intra and inter batch precision and accuracy
Intra and inter batch precision and accuracy were determined by analyzing six replicates of QC samples produced at four different concentration levels, i.e., LOQQC, LQC, MQC and HQC, each in a batch and on three different batches, respectively. Precision of the assay was measured by the percent coefficient of variation over different concentration levels. The acceptance criteria for intra and inter batch precision were 20% or better for LLOQ and 15% or better for other non-zero concentrations.
Extraction Efficiency
The extraction efficiency was obtained by comparing the peak area of six replicates of FLX, ST and STA spiked in plasma at three different concentration levels, i.e., LQC, MQC and HQC with the peak area of processed blank (reconstituted with equivalent amounts of LQC, MQC and HQC in mobile phase). The % CV at all levels of QC’s must be <20%.
RESULTS
Several columns and Combinations of the mobile phase were tried to achieve good resolution and symmetric peaks and a low retention time. Acetonitrile and phosphate buffer (25 mM, pH 4.5) in the ratio of 65:35, v/v was found to be a suitable mobile phase. This ratio of the organic phase to the aqueous phase was very critical in eluting all the analytes as these were having different physicochemical properties. So it was difficult to set chromatographic conditions that produced sharp peak shape and adequate response. Good resolution and good peak shape was achieved using an Phenomenex C18 column (150 x 2 mm, 3 μm particle size) and the above mentioned mobile phase (Fig. 1 and 2). The flow rate was optimized to 0.3 ml/min. The retention time for FLX, ST, STA and IS were 1.5, 8.5, 3.7 and 5.0 min respectively, making it possible to quantify all the analytes in a short time and in a single run.
Selectivity
The method employed for the extraction of FLX, ST, STA and IS offered good selectivity for the analysis in the rat plasma. The area observed in all the lots of blank plasma was less than 20% in the LLOQ area, and the area observed at the RT of IS was less than 5%. The selectivity results with the chromatograms of FLX, ST, STA and IS in blank plasma and spiked plasma are shown in Fig. 1 and 2. No interferences were observed for FLX, ST, STA and IS. The retention time for all the analytes was less than 9 min, which makes it suitable for the analysis large number of sample in short duration as the total run time was 10 minutes.
Linearity
Linearity of FLX, ST and STA was established over a concentration range of 10-1500 ng/ml for FLX and 10-1000 ng/ml for ST and STA respectively in spiked rat plasma samples. Linear coefficient of regression for FLX (r2>0.983), for ST (r2>0.972) and for STA (r2>0.993) was obtained using least squares linear regression model using peak area. The limit of quantitation in the present method was 10 ng/ml for FLX, ST, and STA.
Intra and inter batch precision and accuracy
Three, batches were taken into consideration for each analyte to check intra and inter batch precision and accuracy. The results for precision and accuracy are summarized in Table 1, 2, 3, 4, 5 and 6. Intra- and inter-CV values for FLX ranged from 4.69 to 12.61, for ST 3.36-13.38 and for STA it ranged from 3.73 to 12.93% respectively. The accuracy for FLX ranged from 95.48 to 104.51, for ST 94.73 to 108.52 and for STA it ranged from 98.01 to 104.51% respectively.
 |
Figure 1. Representative chromatogram of extracted blank plasma sample. Click here to view full image |
 |
Figure 2. Representative chromatogram of spiked plasma sample extracted with LQCs of FLX, ST, STA and 300 ng/ml of IS. Click here to view full image |
 |
Table 1. Intra assay precision and accuracy for ST. Click here to view full image |
 |
Table 2. Inter assay precision and accuracy for ST. Click here to view full image |
 |
Table 3. Intra assay precision and accuracy for STA. Click here to view full image |
 |
Table 4. Inter assay precision and accuracy for STA. Click here to view full image |
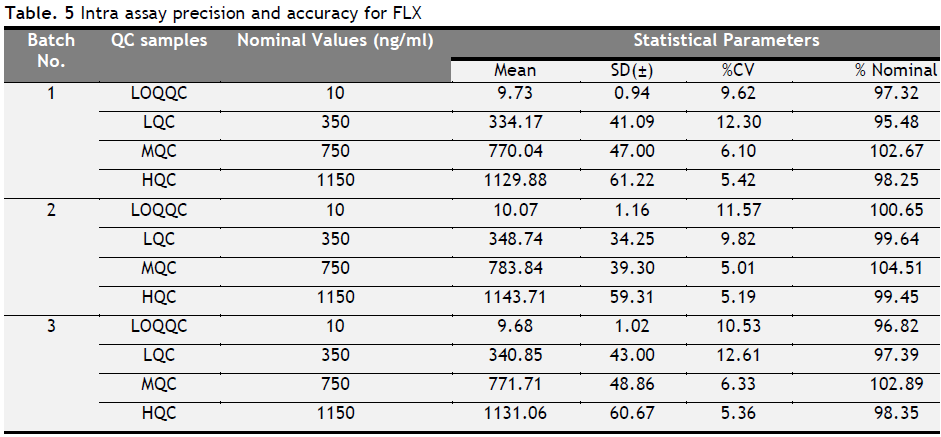 |
Table 5. Intra assay precision and accuracy for FLX. Click here to view full image |
 |
Table 6. Inter assay precision and accuracy for FLX. Click here to view full image |
Recovery
The recovery of FLX, ST, and STA was calculated by using triplicate samples. The mean recovery of FLX, ST, and STA was found to be 73.37, 79.20 and 69.99%, respectively (Table 7). The CV for all the levels of FLX, ST, and STA was below 7.69%.
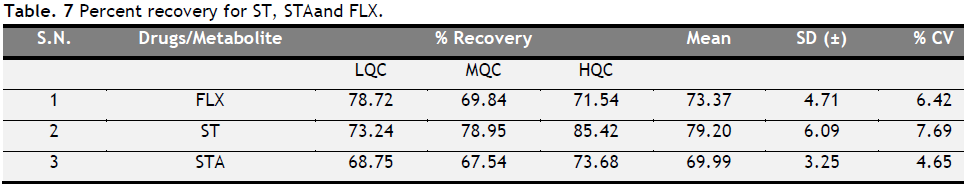 |
Table 7. Percent recovery for ST, STA and FLX. Click here to view full image |
DISCUSSION
For the successful conduct of preclinical and/or biopharmaceutics and clinical pharmacological studies, the development of selective and sensitive bioanalytical methods plays an important role for the quantitative evaluation of drugs and their metabolites. Mostly in RP-LC analysis the contributing factors to error are insufficient sample extraction procedures. Enrichment of analytes and removal of interference and sample preparation are often the most time consuming steps of an analytical process (Raterink et al., 2014). To achieve higher sensitivity of detection, there is a continuous need for the development of processing methods which are rapid and robust. Much effort was made to make the method more reproducible and robust during method development. Because of good recovery and purity SPE was used for sample extraction rather than liquid–liquid extraction (LLE). The recovery of analyte in the present method was found to be almost 80%. The SPE method has advantage over or any other extraction technique as it is effective even when the solutes are present at extremely low concentrations. In SPE, chances of volatile impurities in the processed sample decreases and possibility of getting cleaner samples increased (Dutta et al., 2012). Conventional LLE extraction techniques are difficult for batch processing and are labor intensive, and time-consuming. LLE techniques require relatively large quantities of organic liquids which are very expensive, toxic and hazardous to the environment. The SPE technique solves many of these problems and has been recognized as a major improvement in sample pre-treatment technique with a vast potential application area (Li et al., 2004).
To develop a method with a desired LLOQ and ULOQ and accuracy the better and economical option is RPLC with UV detection. RPLC methods are capable of discriminating more efficiently as compared to normal HPLC between the analyte and matrix signals.
In this method simultaneous extraction of FLX, ST and STA from plasma was very challenging, as ST and STA undergo rapid interconversion at optimum conditions (Yang, et al., 2005, Zhang, et al., 2010). This conversion depends on pH, temperature, and storage condition and sample extraction methodology. Ionization of FLX is also pH sensitive. Here we develop an efficient extraction and quantitative method for the simultaneous estimation of FLX, ST and STA without gradient flow in rat plasma.
Waters HLB cartridges were used for the extraction as these are able to retain unionized analytes. It provides enhanced performance due to a unique polymeric structural design with a non-retentive, hydroxylated, amide-free surface and a non-polar core to retain small molecules. These cartridges contain hydrophilic N-vinyl pyrolidone and lipophilic divinyl benzene moieties. This mix mode provides an excellent capacity to retain analytes of a wider polarity spectrum (Khuroo, et al., 2008). Phosphate buffer was added to plasma samples, which helped in keeping the analytes in unionized condition and stable. Lipid and protein binding on the polymer surface was reduced which results in cleaner samples and decreased ion suppression.
CONCLUSION
A simple, sensitive, robust and steadfast method has been developed for the simultaneous quantitation of FLX, ST, and STA in rat plasma using solid phase extraction cartridges. The method is specific, precise and accurate in the concentration range of 10-1500 ng/ml for FLX and 10-1000 ng/ml ST and STA respectively in rat plasma. This novel method is able to quantify the FLX, ST, and STA simultaneously in a single run without gradient flow or complex chemical extraction processes and ultimately saves the time and cost both. The specificity and sensitivity of this method make it appropriate for preclinical pharmacokinetics studies of FLX, ST, and STA.
CONFLICT OF INTEREST
None declared.
REFERENCES
Barrett B, Huclova J, Bořek-Dohalský V, Němec B, Jelinek I. Validated HPLC–MS/MS method for simultaneous determination of simvastatin and simvastatin hydroxy acid in human plasma. J Pharm Biomed Anal. 41, 517-526, 2006.
Coruh Ö, Özkan S. Determination of the antihyperlipidemic simvastatin by various voltammetric techniques in tablets and serum samples, Die Pharmazie. Int J Pharm Sci. 61, 285-290, 2006.
Dixit V, Nguyen H, Dixit VM. Solid-phase extraction of fluoxetine and norfluoxetine from serum with gas chromatography—electron-capture detection. J Chromatogr B Biomed Sci Appl. 563, 379-384, 1991.
Dutta L, Ahmad SI, Mishra S, Khuroo A, Monif T. Selective, sensitive, and rapid liquid chromatography-tandem mass spectrometry method for determination of Glimepiride in human plasma. Clin Res Regul Aff. 29, 15-22, 2012.
Gatti G, Bonomi I, Marchiselli R, Fattore C, Spina E, Scordo G, Pacifici R, Perucca E. Improved enantioselective assay for the determination of fluoxetine and norfluoxetine enantiomers in human plasma by liquid chromatography. J Chromatogr B. 784, 375-383, 2003.
Guo X, Fukushima T, Li F, Imai K. Determination of fluoxetine enantiomers in rat plasma by pre-column fluorescence derivatization and column-switching high-performance liquid chromatography. Analyst. 127, 480-484, 2002.
Holladay JW, Dewey MJ, Yoo SD. Pharmacokinetics and antidepressant activity of fluoxetine in transgenic mice with elevated serum alpha-1-acid glycoprotein levels. Drug Metab Dispos. 26, 20-24, 1998.
Jemal M, Ouyang Z, Powell ML. Direct-injection LC–MS–MS method for high-throughput simultaneous quantitation of simvastatin and simvastatin acid in human plasma. J Pharm Biomed Anal. 23, 323-340, 2000.
Kaddoumi A, Nakashima MN, Nakashima K. Fluorometric determination of DL-fenfluramine, DL-norfenfluramine and phentermine in plasma by achiral and chiral high-performance liquid chromatography. J Chromatogr B Biomed Sci Appl. 763, 79-90, 2001.
Khuroo A, Mishra S, Singh O, Saxena S, Monif T. Simultaneous determination of atenolol and chlorthalidone by LC–MS–MS in human plasma. Chromatographia. 68, 721-729, 2008.
Kuzaj P, Kuhn J, Faust I, Knabbe C, Hendig D. Measurement of HMG CoA reductase activity in different human cell lines by ultra-performance liquid chromatography tandem mass spectrometry. Biochem Biophys Res Commun. 443, 641-645, 2014.
Li KM, Thompson MR, McGregor IS. Rapid quantitation of fluoxetine and norfluoxetine in serum by micro-disc solid-phase extraction with high-performance liquid chromatography–ultraviolet absorbance detection. J Chromatogr B. 804, 319-326, 2004.
Maya MT, Domingos CR, Guerreiro MT, Morais JA. Determination of the antidepressant fluoxetine in human plasma by LC with UV detection. J Pharm Biomed Anal. 23, 989-996, 2000.
Morris M, Gilbert J, Hsieh JK, Matuszewski B, Ramjit H, Bayne W. Determination of the HMG–CoA reductase inhibitors simvastatin, lovastatin, and pravastatin in plasma by gas chromatography/chemical ionization mass spectrometry. Biol Mass Spectrom. 22, 1-8, 1993.
Patel JK, Sutariya VB. Micronisation of simvastatin by the supercritical antisolvent technique: in vitro-in vivo evaluation. J Microencapsul. 1-8, 2014.
Raterink R-J, Lindenburg PW, Vreeken RJ, Ramautar R, Hankemeier T. Recent developments in sample-pretreatment techniques for mass spectrometry-based metabolomics. Trends Anal Chem. 61, 157-167, 2014.
Rosolova H, Dobiasova M, Soska V, Blaha V, Ceska R, Nussbaumerova B, Pelikanova T, Soucek M. Combined therapy of mixed dyslipidemia in patients with high cardiovascular risk and changes in the lipid target values and atherogenic index of plasma. Cor et Vasa. 56, e133-e139, 2014.
Santos T, Baungratz MM, Haskel SP, de Lima DD, da Cruz JN, Dal Magro DD, da Cruz JGP. Behavioral interactions of simvastatin and fluoxetine in tests of anxiety and depression. Neuropsychiatr Dis Treat. 8, 413. 2012.
Srinivasu M, Raju AN, Reddy GO. Determination of lovastatin and simvastatin in pharmaceutical dosage forms by MEKC. J Pharm Biomed Anal. 29, 715-721, 2002.
Thomare P, Wang K, Van Der Meersch-Mougeot V, Diquet B. Sensitive micromethod for column liquid chromatographic determination of fluoxetine and norfluoxetine in human plasma. J Chromatogr B Biomed Sci Appl. 583, 217-221, 1992.
Tournel G, Houdret N, Hedouin V, Deveaux M, Gosset D, Lhermitte M. High-performance liquid chromatographic method to screen and quantitate seven selective serotonin reuptake inhibitors in human serum. J Chromatogr B Biomed Sci Appl. 761, 147-158, 2001.
Wang L, Asgharnejad M. Second-derivative UV spectrometric determination of simvastatin in its tablet dosage form. J Pharm Biomed Anal. 21, 1243-1248, 2000.
Yang AY, Sun L, Musson DG, Zhao JJ. Application of a novel ultra-low elution volume 96-well solid-phase extraction method to the LC/MS/MS determination of simvastatin and simvastatin acid in human plasma. J Pharm Biomed Anal.38, 521-527, 2005.
Yang H, Feng Y, Luan Y. Determination of Simvastatin in human plasma by liquid chromatography–mass spectrometry. J Chromatogr B. 785, 369-375, 2003.
Zhang J, Rodila R, Gage E, Hautman M, Fan L, King LL, Wu H, El-Shourbagy TA. High-throughput salting-out assisted liquid/liquid extraction with acetonitrile for the simultaneous determination of simvastatin and simvastatin acid in human plasma with liquid chromatography. Anal Chim Acta. 661, 167-172, 2010.
Zhao JJ, Xie IH, Yang AY, Roadcap BA, Rogers J. Quantitation of simvastatin and its β‐hydroxy acid in human plasma by liquid–liquid cartridge extraction and liquid chromatography/tandem mass spectrometry. J Mass Spectromet. 35, 1133-1143, 2000.

 This work is licensed under a Creative Commons Attribution-NonCommercial-ShareAlike 4.0 International License.