


Ahmed Sabir Abdelkarim1,2, Babar Ali1*, Mohammad Ali2, Maqsood Ali3
1College of Pharmacy and Dentistry, Buraydah Private College, Al-Qassim, P.O. 1126, Kingdom of Saudia Arabia (KSA).
2Department of Pharmacognosy & Phytochemistry, Faculty of Pharmacy, Jamia Hamdard, New Delhi -110062, India.
3Department of Pharmacognosy, College of Pharmacy, Jazan University, Jizan, P.O. 114, Kingdom of Saudi Arabia (KSA).
SHORT COMMUNICATION
Volume 2, Issue 3, Page 165-168, September-December 2014.
Article history
Received: 20 October 2014
Revised: 20 November 2014
Accepted: 10 December 2014
Early view: 27 December 2014
*Author for correspondence
E-mail: [email protected]
Aim of the present study was to develop a high performance thin layer chromatography (HPTLC) method to determine the diosgenin content variation in geographically different fenugreek seeds from Sudan and India. Chloroform extracts of fenugreek seeds were used to quantify diosgenin and compare with standard diosgenin (1 mg/ml). Different compositions of the organic solvents were tried to develop new solvent system, chloroform: methanol: toluene (5:1:1). Standard calibration curve was prepared by increasing the concentration of standard compound with the standard equation as y = 1427.x + 1372, R2 = 0.961. The standard equation was used to calculate the diosgenin content. HPTLC results revealed Rf value of diosgeninas 0.29, 0.30 in various tracks. The scanning of the TLC plates was carried out at 550 nm. The Sudanese sample consists of 0.12% (w/w) diosgenin which is approximately double of Indian sample 0.069% (w/w). HPTLC technique was found to be the best analytical technique to quantify diosgenin with excellent precision at low cost. The analysis is effective to determine the content variation in different geographical regions which could be the best approach to target the best source with high content of secondary metabolites.
Keywords: HPTLC, Diosgenin, Trigonellafoenum-graecum L.
INTRODUCTION
Trigonellafoenum-graecum Linn. is an annual plant belongs to family Fabaceae, commonly known as fenugreek. It is extensively cultivated in Mediterranean region, North Africa, Yemen and as a food crop in India. Fenugreek seed, in addition to its nutrients property, exhibit bioactivities such as antihyperglycemic and antihyperlipidemic. The fenugreek seeds have flavonoids, flavanol glycosides (Han et al., 2001; Petropoulos, 2002; Belguith et al., 2013; Omezzine et al., 2014), alkaloids, saponins and carbohydrates (Chauhan et al., 2010). Diosgenin is a major bioactive constituent of seeds which plays as lead molecule for the synthesis of sex hormone, steroidal diuretics and cortisone. Diosgenin is mainly employed in human medicine (Subohet al., 2004) as hypoglycemic, hypocholesteremic, anticancer, gastroprotective effects (Sharma et al.,1990; Ajabnoor et al., 1998; Pandian et al., 2002) diabetes, obesity (Ulbricht et al., 2007) and hypolipidemic (Sauvaire et al., 2000). Due to the geographical distribution, developmental stage and the climatic factors the content of diosgenin vary in a range between 0.8- 2.2% from Morocco, Ethiopia, India and Pakistan (Evans, 2002). The present study was undertaken to quantify diosgenin content variation between two geographically different samples of fenugreek seeds from Sudan and India by high performance thin layer chromatography (HPTLC).
Although there are so many techniques to analyze the phytoconstituents quantitatively but the HPTLC is considered best to compare the samples on the basis of finger print profile which is less time consuming and more effective (Mukherjee et al., 2002). Now a day’s HPTLC becomes one of the powerful tools to link the botanical identity to the chemical constituent’s profile of the plant. It provides the means for flexible screening procedure, qualitative and quantitative determination (Gunalan et al., 2012).
MATERIALS AND METHODS
Plant material: Trigonellafoenum-graecum L. seeds were procured from Al-Oshara market, Khartoum city, Sudan and Khari Baoli market, New Delhi, India. Sudanese and Indian Fenugreek seeds were identified and authenticated by Mr. Wail E. Abdalla, plant taxonomist (Medicinal and Aromatic Plant Research Institute, Khartoum, Sudan) and Dr. HB Singh, Scientist F (Raw Material Herbarium and Museum, NISCAIR, New Delhi, india) respectively. Voucher specimen of both samples with reference number Y91/07 and NISCAIR/RHMD/Consult/-2008-09/997/28 respectively have been deposited for future reference.
Chemicals and Reagents: Chemicals and reagents i.e. methanol, ethyl acetate, toluene and chloroform of analytical grade were purchased from Merck (Mumbai, India). Diosgenin standard (10 gm) was procured from Sigma-Aldrich, India and dissolved in 10 ml of chloroform in a volumetric flask to prepare final concentration of standard 1mg/ml.
Preparation of extract for analysis: 50 g of coarsely powdered seeds of each origin were extracted with methanol individually in a Soxhlet apparatus for 6 hours. The methanol extract concentrated under the reduced pressure up to 10 ml, to be used for the fingerprint profile of each sample then 50 ml of ethyl acetate was added in order to precipitate crude saponins fraction (Mukherjeeet al., 2002). The precipitate then dried to yield 4 g each of the Sudanese and the Indian originated seeds. The precipitates of each then hydrolyzed individually with 1N HCl, (50 ml) aqueous solution under reflux for 4 hours (Harborne, 1998). After neutralization of the hydrolyzed mixture, the water insoluble precipitates was filtered and dissolved in 40 ml of chloroform of each plant individually, to be used for the diosgenin quantification.
Preparation of calibration curve of diosgenin standard: The standard solution of diosgenin (1mg/ml) was applied on the HPTLC plate in increasing order from 1μl, to 9 μl i.e. 1 μg to 9 μg per band. The visible detection was obtained on 3μl, 4μl, 5μl, 6μl, 7μl, 8μl and 9μl track. The calibration curve of diosgenin was obtained by plotting peaks areas vs. applied concentration of diosgenin.
Chromatographic conditions and instrumental specifications of HPTLC: Chromatography was carried out on aluminium HPTLC plates (10×10 cm), precoated with silica gel 60F254, 0.2 mm layer thickness (E. Merck, Darmstadt, Germany) and samples were applied with Linomat V applicator attached and controlled with Win CATS software (CAMAG) with the help of 100 μl syringe with bandwidth of 4 mm and the flow rate was adjusted to 150 nl/s. The ascending migration was adjusted to 80 mm by leaving 10 mm of the lower edge of the plate. The chromatograph was developed in TLC- Twin-Trough chamber (10 cm×10 cm)and (20 cm ×10 cm) previously saturated using solvent system, chloroform : methanol : toluene (5:1:1) at 25±2 ºC, RH The air-dried plates were viewed under different wavelength of UV light (254nm and 366 nm) before and after spraying with vanillin-sulfuric acid reagent. The HPTLC plates were sprayed with vanillin-sulfuric acid reagent to visualize Diosgenin. The densitometric analysis and scanning was performed at λmax = 550 nm with TLC-scanner 3 equipped with CamagW in CATS software using Tungsten light source.
Quantification of diosgenin in the plant samples: A volume of 8 μl of both the plant samples was applied in duplicate of each plant extract individually. The amount of diosgenin in both plant samples was calculated using the standard calibration curve of diosgenin by using the standard equation y = 1427.x + 1372, R2= 0.961.
RESULTS
HPTLC plates of the samples along with standard were visualized at 254 nm and 366 nm. Figure 1A showed the plate of diosgenin standard calibration with increased concentration from 1 µg to 9 µg per band and was found linear at 254 nm. HPTLC plate of both the samples after derivatization with vanillin-sulfuric acid reagents at 366 nm was shown in Figure 1B. Standard calibration plot with increased concentration of diosgenin was displayed in Figure 2. All tracks with their peaks scanned at 550 nm have been visualized in Figure 3. Table 1 showed the results of Sudanese and Indian samples respectively comprising first with the different Rfof 8 bands of different components and later with the 10 bands of different components. The details of standard, Rfofdiosgenin and its presence in both the samples were shown in Table 2. Diosgenin was detected at Rf 0.29, 0.30 in all tracks of the samples and standard. Figure 4 represented HPTLC chromatogram of Sudanese fenugreek, standard diosgenin and Indian samples. Quantification of diosgenin in Trigonellafoenum-graecum L. seeds of Sudanese origin was determined by using the standard calibrated equation and found to be 0.12% (w/w) which was approximately double than Indian origin fenugreek 0.069% (w/w).
 |
Figure 1. (A) Photograph of HPTLC plate of diosgenin quantification at 254 nm; (B) HPTLC plate after derivatization with vanillin-sulfuric acid reagents at 366 nm. Click here to view full image |
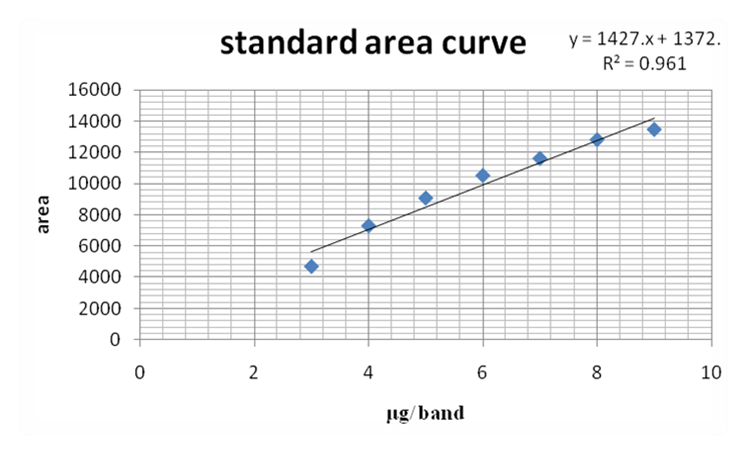 |
Figure 2. Diosgenin standard calibration curve showing a linearity relationship. Click here to view full image |
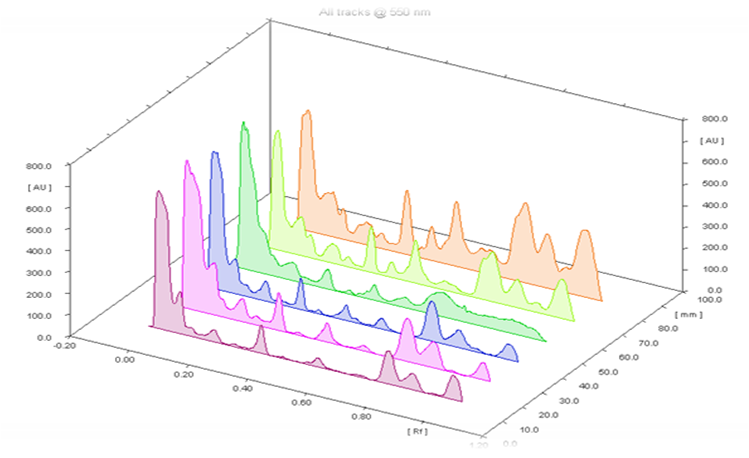 |
Figure 3. All tracks scanned at wavelength 550 nm after derivatization with 10% sulfuric acid. Click here to view full image |
 |
Figure 4(i). Peak display of track-13 of Sudanese fenugreek (8μl/band). Click here to view full image |
 |
Figure 4(ii). Peak display of track-8 diosgenin standard (8μl/band). Click here to view full image |
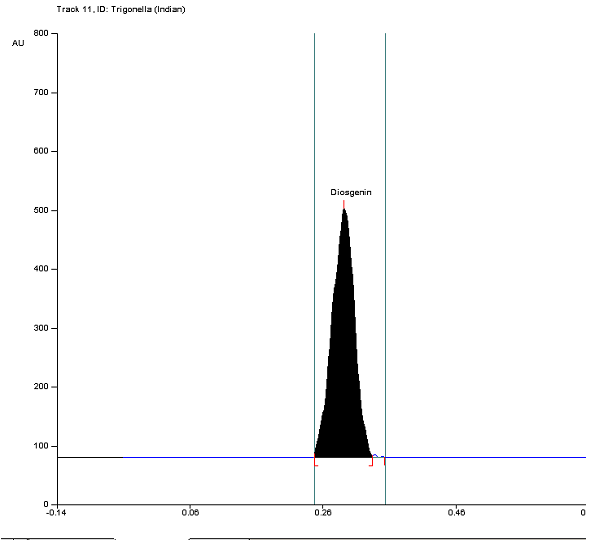 |
Figure 4(iii). Peak display of track-11of Indian fenugreek (8μl/band). Click here to view full image |
 |
Table1. Track-3 Sudanese fenugreek and Track-1 Indian fenugreek methanol extract peaks. Click here to view full image |
 |
Table 2. Standard diosgenin peak area curve data along with samples. Click here to view full image |
DISCUSSION
Different compositions of the organic solvents were tried to develop the solvent system for chloroform extract of Sudanese and Indian fenugreek seeds samples and standard diosgenin. The high resolution and reproducible results were obtained by using chloroform: methanol: toluene (5:1:1) as mobile phase. The plate consisting of samples along with standard was sprayed with derivatizing reagent vanilline-sulphuric acid and was scanned at 550 nm for highest sensitivity. Quantification of diosgenin as 0.12% (w/w) and 0.069% (w/w) in the Sudanese and Indian fenugreek seeds supports the already known fact about geographical content variation of phytoconstituents due to climatic factors and genetic interference. Triplicate analysis of the seeds and standard was followed to determine the accuracy of the experimental and technical part. HPTLC technique was found to be best analytical technique to quantify diosgenin with excellent precision at low cost and eventually high content species and germplasm can be targeted to meet the requirement of biological system and pharmaceutical industries.
CONCLUSION
HPTLC becomes one of the powerful tools to link the botanical identity to the chemical constituent’s profile of the plant. It provides the means for flexible screening procedure, qualitative and quantitative determination. HPTLC analysis is effective to determine the content variation in different geographical regions which could be the best approach to target the source with high content of secondary metabolites.
CONFLICT OF INTEREST
None declared.
REFERENCES
Ajabnoor M, Tilmisany A. Effect of Trigonellafoenum-graecum on blood glucose levels in normal and alloxan-diabetic mice. J Ethnopharmacol. 22, 45-49, 1998.
Belguith HO, Bouaziz M, Jamoussi K, Simmonds SJM, El-Feki A, Makni AF. Comparative study on hypocholesterolemic and antioxidant activities of various extracts of fenugreek seeds. Food Chem. 138, 1448-1453, 2013.
Chauhan G, Sharma M, Kharkwal H, Verma A. Pharmacognostic, preliminary phytochemical studies and anticancerous potential of Trigonellafoenum-graecum. Pharm Sci Manitor. 2, 350-359, 2010.
Evans WC. Pharmacognosy, 15th Edition.Harcourt publishers Ltd. Edinburgh. 2002.
Gunalan G, Saraswathy A, Vijaylakshmi K. HPTLC fingerprint profile of Bauhinia variegate Linn. leaves. Asian Pac J Trop Dis. S21-S25, 2012.
Han Y, Nishibe S, Noguchi Y, Jin Z. Flavonol glycosides from the stems of Trigonellafoenum-graecum. Phytochemistry. 58, 577-580, 2001.
Harborne, Phytochemical Methods.3rd Edition. New Delhi, India, pp. 136-137, 1998.
Mukherjee PK. Quality control of herbal drugs, 1st Edition. Business Horizons, Pharmaceutical Publishers, Delhi, India. 2002.
Omezzine F, Remadi MD, Ladhari A, Haouala R. Variation in phytochemical content and antifungal activity of Trigonellafoenum-graecum L. with plant developmental stage and ploidy level. S Afr J Bot. 92, 120-125, 2014.
Pandian S, Anuradha C, Viswanathan P. Gastroprotective effect of fenugreek seeds (Trigonellafoenum-graecum) on experimental gastric ulcer in rats. J Ethnopharmacol. 81, 393-397, 2002.
Petropoulos GA. Fenugreek—The genus Trigonella. Taylor and Francis: London and New York, 2002.
Sauvaire Y, Petit P, Baissac Y, Ribes G. Chemistry and pharmacology of fenugreek. In: Herbs, botanicals and teas. Mazza G and Oomah BD (edition). Technomic Pub. Co: Lancaster, Pensylvannia. 2000.
Sharma R, Raghuram T, Rao N. Effects of fenugreek seeds on blood glucose and serum lipid in type I diabetes. Eur J Clin Nutr.44, 301-306, 1990.
Suboh SM, Bilto YY, Aburjai TA. Protective effects of selected medicinal plants against protein degradation, lipid peroxidation and deformability loss of oxidatively stressed human erythrocytes. Phytother Res.18, 280-284, 2004.
Ulbricht C, Basch E, Burke D, Cheung L, Ernst E, Giese N. Fenugreek (Trigonellafoenum-graecum L. Leguminosae): an evidence-based systematic review by the natural standard research collaboration. J Herb Pharmacother. 7, 143-177, 2007.

 This work is licensed under a Creative Commons Attribution-NonCommercial-ShareAlike 4.0 International License.